
KUBOTA Worldwide
Stopping Climate Change
| The 5th report by Intergovernmental Panel on Climate Change (IPCC) says
that warming of the climate system is happening with no doubt and that
it is evident that the human influence is one of the causes. The KUBOTA
Group works on CO2 reduction to prevent global warming, mainly through
our energy-saving activities. |
Stopping Climate Change
| 1. | The targets of the Medium-Term Environmental Conservation Plan for FY2016
and the results for FY2015 (Reduction of CO2 emissions from KUBOTA Group business sites) |
| Actions | Management Indicators*1 | Scope | Base FY |
Targets FY2016 |
Results FY2015 |
*3 Self- evaluation |
Achievement Status |
| Reduce CO2 | CO2 emissions per unit of production*2 | Global Production | 2009 | -14% | -26.0% |  |
We are making progress on energy conservation in production facilities, air handling systems and lighting, etc. |
| Energy conservation | Energy use per unit of production | Global Production | 2009 | -14% | -23.4% | |
| *1 | The figures per unit of production represent the intensity of the environmental load per unit of production money amount. The exchange rate of the base fi scal year is used when translating the production value of overseas sites into yen. |
| *2 | CO2 emissions include greenhouse gases from non-energy sources. We use the emissions coeffi cient for electricity of the base fi scal year in our calculation of CO2 emissions from energy sources. |
| *3 | Self-evaluation rating symbols:  Target exceeded (by at least 20%) Target exceeded (by at least 20%)  Target reached Target reached  Target not yet reached. Target not yet reached. |
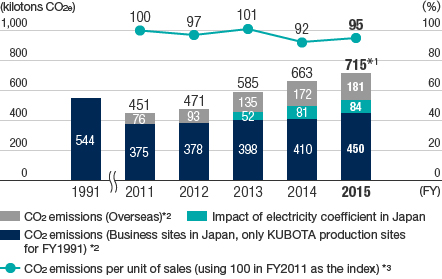
| 2. | Trends of CO2 emissions and CO2 emissions per unit of sales |
|
|
| *1 | CO2 emissions (715 kilotons CO2e) include portions of CO2 that were not released into the atmosphere but absorbed as carbon into products such as iron pipe (33 kilotons CO2e). |
| *2 | CO2e emissions after FY2011 include greenhouse gases from non-energy sources. |
| *3 | CO2 emissions per unit of consolidated net sales. |
| In FY2015, CO2 emissions were 715 kilotons CO2e, an increase of 7.9% compared to the previous fiscal year. We made efforts to conserve energy such as converting to alternative fuels and upgrading to highly efficient equipment. However, CO2 emissions increased owing to increasing production at cast iron production sites in Japan, expanding aggregation scope in Japan and increasing production overseas. Additionally, CO2 emissions per unit of sales increased 2.6% compared to the previous fiscal year. | |
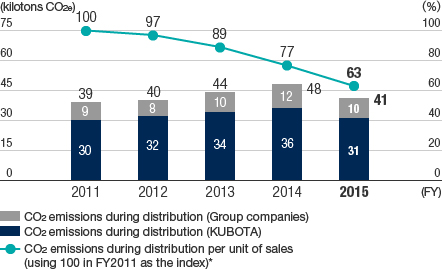
| 3. | CO2 emissions during distribution(Business sites in Japan) |
|
|
| * | CO2 emissions during distribution per unit of consolidated net sales. |
| In FY2015, CO2 emissions during distribution were 41 kilotons CO2e, a reduction of 15.0% compared to the previous fiscal year. Additionally, CO2 emissions during distribution per unit of sales decreased 19.2%. This was the result of improved transportation efficiency by shipping mixed cargo and reducing transportation distance by routing more exports to ports that are closer to the actual destination. | |
| 4. | CO2 emissions by scope(BY 2015 results) |
| Classification | Scope of calculation | CO2 emissions(kilotons CO2e) | |
| Emissions of the KUBOTA Group's business sites | Direct emissions (Scope 1) | Use of fossil fuels | 355 |
| Non-energy-related greenhouse gas emissions | 8 | ||
| Indirect emissions (Scope 2) | Purchased electricity use | 353 | |
| Upstream and downstream emissions | Other indirect emissions (Scope 3) | Extraction, production and transportation of fuels for generation of electricity used | 25 |
| Disposal of waste emitted from bases | 22 | ||
| Employee business trips | 8 | ||
| Transportation of products and waste | 41 | ||
| Construction and Manufacturing of capital goods such as equipment | 170 | ||
| Use of sold products | 15,494 | ||
| The KUBOTA Group has been working to figure out the CO2 emission from the
entire value chain and disclosing a part of Scope 3 emissions. * The scope of business emissions as defined in the Greenhouse Gas (GHG) Protocol Scope 1: Direct GHG emissions from businesses themselves Scope 2: Indirect emissions associated with the consumption of electric power, heat, and steam supplied by others Scope 3: Indirect emissions other than scope 2 (others emissions related to business activities) |
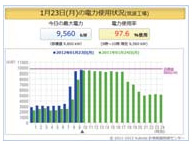
| 5. | Activities to reduce CO2 emissions |
 |
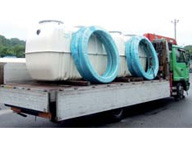 |
| The maximum power usage for the overall plant (hourly transitions) is visualized as a graph. On some of the production lines, they have worked on visualization of power usage in units of facilities to lead to improvements. | The empty spaces of vehicles are effectively utilized through mixed loading of products with multiple projects with different load handling measures. We will continue to accumulate the know-how and records that would lead to energy saving in the field of logistics. |


