
KUBOTA Worldwide
Working toward
a Recycling-based Society
| After going through the society of mass production, mass consumption and mass disposal, we now face many problems including depletion of resources and shortage of water. To address the formation of a recycling society, the KUBOTA Group works on waste reduction and recycling, and effective utilization of water resources. |
Reduce Waste
| 1. | The targets of the Medium-Term Environmental Conservation Plan for FY2016 and the results for FY2015 |
| Actions | Management Indicators*1 | Scope | Base FY |
Targets FY2016 |
Results FY2015 |
*3 Self- evaluation |
Achievement Status |
| Reduce waste | Waste discharge per unit of production | Global Production | 2009 | -14% | -30.6% |  |
We are making progress on waste separation and introduction of returnable containers. |
| Recycling ratio*2 | Production sites in Japan | ’╝Ź | 99.5% or above | 99.8% |  |
We are maintaining a resource recycling ratio above the target. | |
| Overseas produciton sites | ’╝Ź | 90.0% or above | 89.8% |  |
Landfill disposal was reduced as the result of changing contractor consignment. We are now very close to achieving our target. |
| *1 | The figures per unit of production represent the intensity of the environmental load per unit of production money amount. The exchange rate of the base fi scal year is used when translating the production value of overseas sites into yen. |
| *2 | Resource recycling ratio (%) = (Sales volume of valuable resources + External recycling volume) / (Sales volume of valuable resources + External recycling volume + Landfi ll disposal) ├Ś 100. Heat recovery is included in external recycling volume. |
| *3 | Self-evaluation rating symbols:  Target exceeded (by at least 20%) Target exceeded (by at least 20%)  Target reached Target reached  Target not yet reached. Target not yet reached. |
| 2. | Trends of waste ,etc. discharge (including valuable resources) and waste discharge per unit of sales |
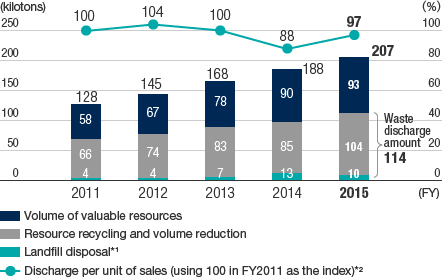 |
|
| *1 | Landfill disposal = Direct landfill disposal + Final landfill disposal following intermediate treatment |
| *2 | Waste discharge per unit of consolidated net sales. Waste discharge = Recycled resources / Volume reduction + Landfill disposal |
| In FY2015, the waste discharge amount was 114 kilotons, an increase of 16.1% compared to the previous fiscal year. We made efforts to thoroughly sort waste and recycle valuable resources. However, the waste discharge amount increased owing to increased production at domestic cast iron production sites, expanding aggregation scope in Japan and increasing production overseas. The waste discharge amount per unit of sales also increased 10.4% compared to the previous fiscal year. | |
| 3. | Trends in recycling ratio |
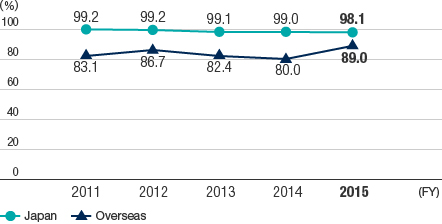
|
|
| * | Starting in FY2014, heat recovery has been included in external recycling volume. The resulting difference compared with the previous method that did not include heat recovery is minor. |
| The resource recycling ratio in FY2015 was 98.1% in Japan, down 0.9 points compared to the previous fiscal year. This was due to the influence of expanding the aggregation scope. On the other hand, overseas, the promotion of conversion into valuable resources and recycling led to increasing the recycling ratio by 9 points, totaling 89.0%. | |
| 4. | Activities to reduce waste |
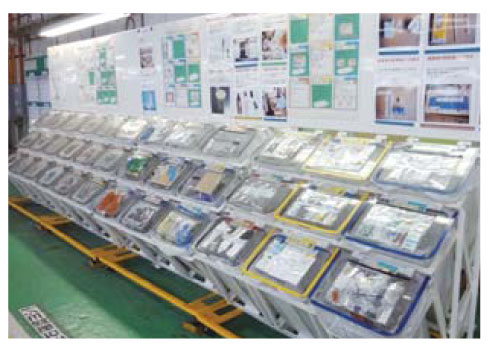 |
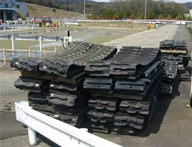 |
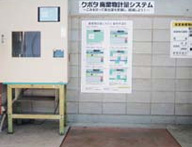 |
| Each plant works on minutely classified collection of wastes and takes thorough measures for recycling. Instructions on waste classification are given to the employees in an easily understood manner. | By effectively utilizing the casting business, we promote recycling within the group by turning waste oil into fuel and collecting and recycling sources of iron such as waste crawlers from construction machinery, waste metal chips and grinding sludge | We promote the introduction of waste management using measuring systems. Reduction activities are encouraged through visualization of which work place reduced how much waste. |
Conserve Water Resources
| 1. | The targets of the Medium-Term Environmental Conservation Plan for FY2016 and the results for FY2015 |
| Actions | Management Indicators*1 | Scope | Base FY |
Targets FY2016 |
Results FY2015 |
*2 Self- evaluation |
Achievement Status |
| Conserve water resouce | Water consumption per unit of production | Grobal production | 2009 | -21% | -39.1% | |
We are making progress on water conservation by the installation of waste water recycling facilities. |
| *1 | The figures per unit of production represent the intensity of the environmental load per unit of production money amount. The exchange rate of the base fi scal year is used when translating the production value of overseas sites into yen. |
| *2 | Self-evaluation rating symbols: Target exceeded (by at least 20%) Target reached Target not yet reached. |
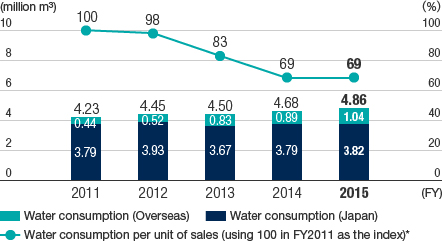
| 2. | Trends of total water consumption and consumption per unit of sales |
|
|
| *1 | Water consumption per unit of consolidated net sales. |
| In FY2015, water consumption was 4.86 million m3, an increase of 3.8% compared to the previous fiscal year. We made efforts to utilize water resources effectively by water conservation activities and recycling wastewater. However, water consumption increased due to an increase in overseas production volume. As a result, water consumption per unit of sales decreased 1.3% compared to the previous fiscal year. | |
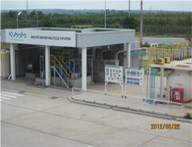
| 3. | Activities to reduce water consumption |
 |
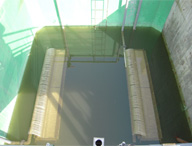 |
| We work on reduction of water use as well as effluent drain into rivers with our effluent recycling membrane treatment facility. Introduction has been started in oversea sites including the developing countries where worsening of environmental pollution is concerned. | |


