Financial Indicators
- Performance Highlights
- Asset Status
- Per Share indicators (Yen)
- Cash Flow
- Capital Expenditures and R&D
Performance Highlights
| Fiscal year ended | IFRS | ||||
|---|---|---|---|---|---|
| Dec. 2021 | Dec. 2022 | Dec. 2023 | Dec. 2024 | Dec. 2025 | |
| Revenue | 2,196.8 | 2,677.0 | 3,020.7 | 3,016.3 | 3,018.9 |
| Operating Profit | 244.6 | 214.4 | 328.8 | 315.6 | 265.5 |
| Profit attributable to owners of the parent | 174.8 | 156.5 | 238.5 | 230.4 | 186.7 |
| IFRS | ||||
|---|---|---|---|---|
| Dec. 2021 | Dec. 2022 | Dec. 2023 | Dec. 2024 | Dec. 2025 |
| Revenue | ||||
| 2,196.8 | 2,677.0 | 3,020.7 | 3,016.3 | 3,018.9 |
| Operating Profit | ||||
| 244.6 | 214.4 | 328.8 | 315.6 | 265.5 |
| Profit attributable to owners of the parent | ||||
| 174.8 | 156.5 | 238.5 | 230.4 | 186.7 |
-
Revenue and Overseas Revenue Ratio
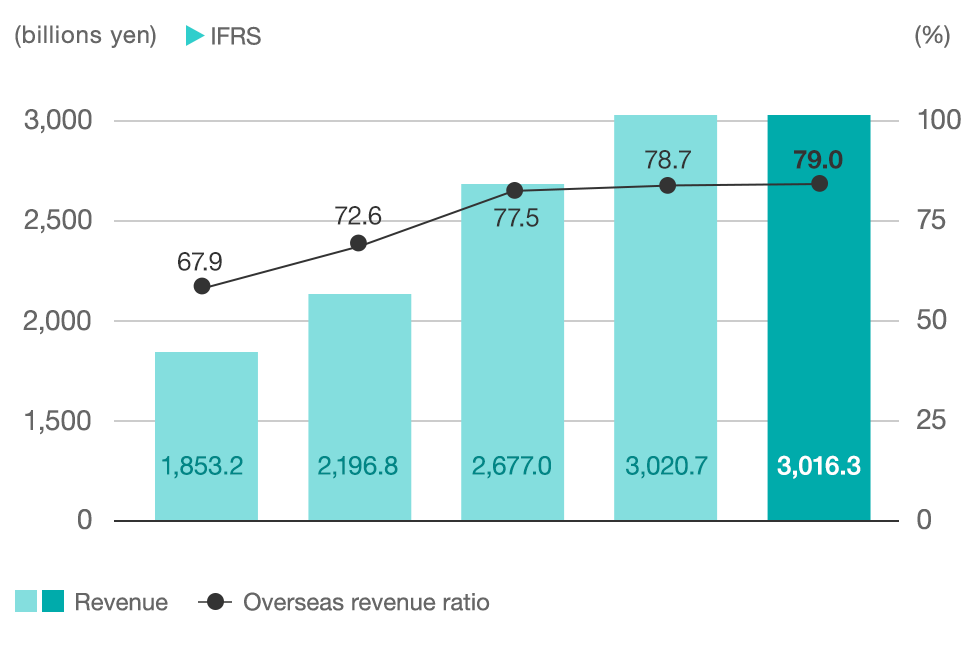
- 2021.12
- 2022.12
- 2023.12
- 2024.12
- 2025.12
-
Operating profit and Operating margin
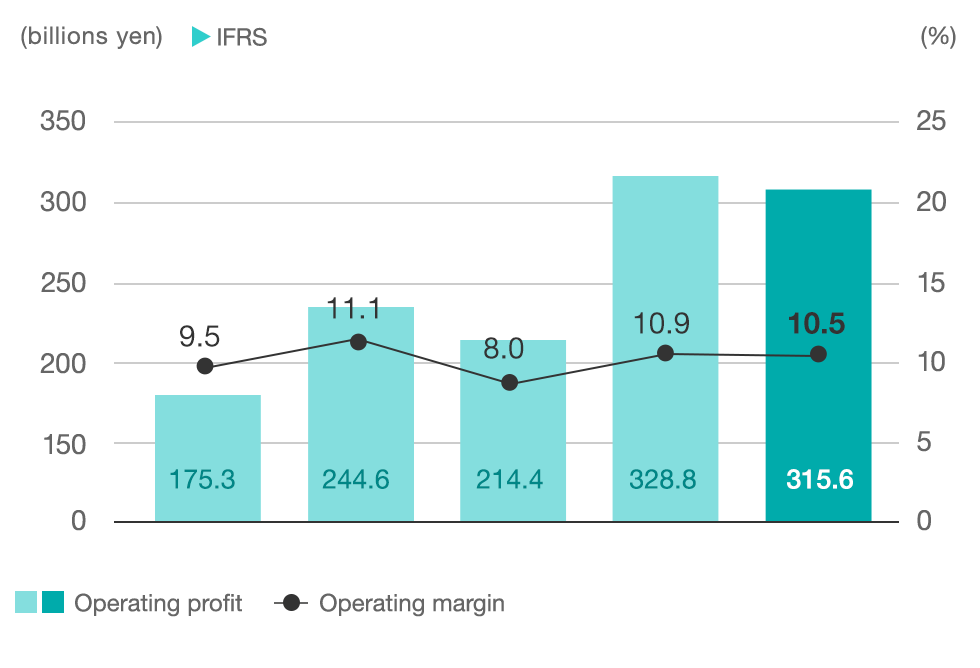
- 2021.12
- 2022.12
- 2023.12
- 2024.12
- 2025.12
-
Profit attributable to owners of the parent and Ratio of profit attributable to owners of the parent to revenue
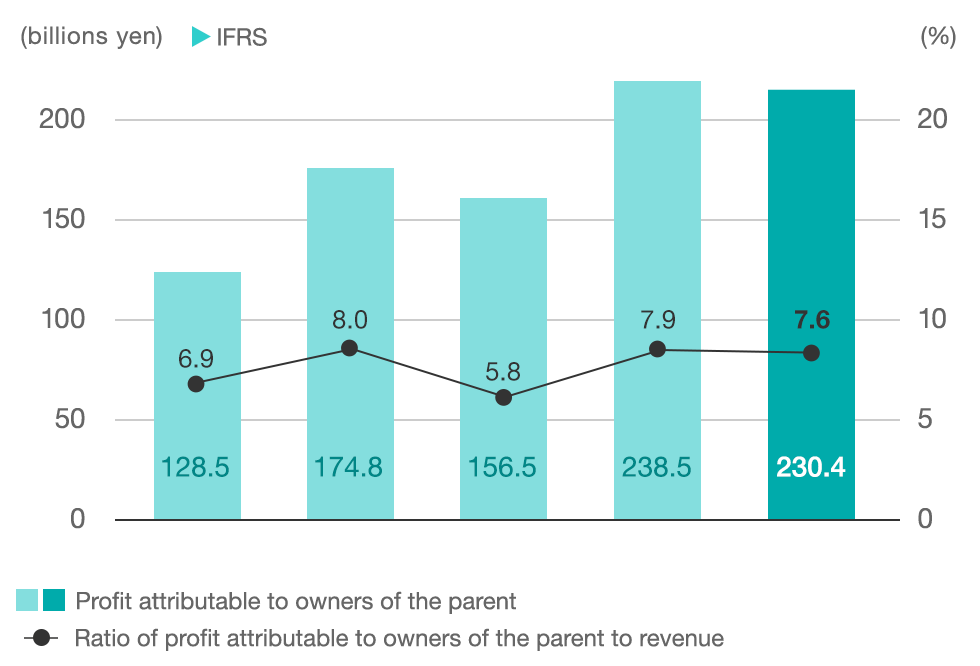
- 2021.12
- 2022.12
- 2023.12
- 2024.12
- 2025.12
Asset Status
| Fiscal year ended | IFRS | ||||
|---|---|---|---|---|---|
| Dec. 2021 | Dec. 2022 | Dec. 2023 | Dec. 2024 | Dec. 2025 | |
| Total Assets | 3,773.7 | 4,765.1 | 5,359.2 | 6,018.7 | 6,204.9 |
| Equity attributable to owners of the parent | 1,678.0 | 1,874.5 | 2,175.8 | 2,477.3 | 2,623.0 |
| IFRS | ||||
|---|---|---|---|---|
| Dec. 2021 | Dec. 2022 | Dec. 2023 | Dec. 2024 | Dec. 2025 |
| Total Assets | ||||
| 3,773.7 | 4,765.1 | 5,359.2 | 6,018.7 | 6,204.9 |
| Equity attributable to owners of the parent | ||||
| 1,678.0 | 1,874.5 | 2,175.8 | 2,477.3 | 2,623.0 |
-
Total Assets
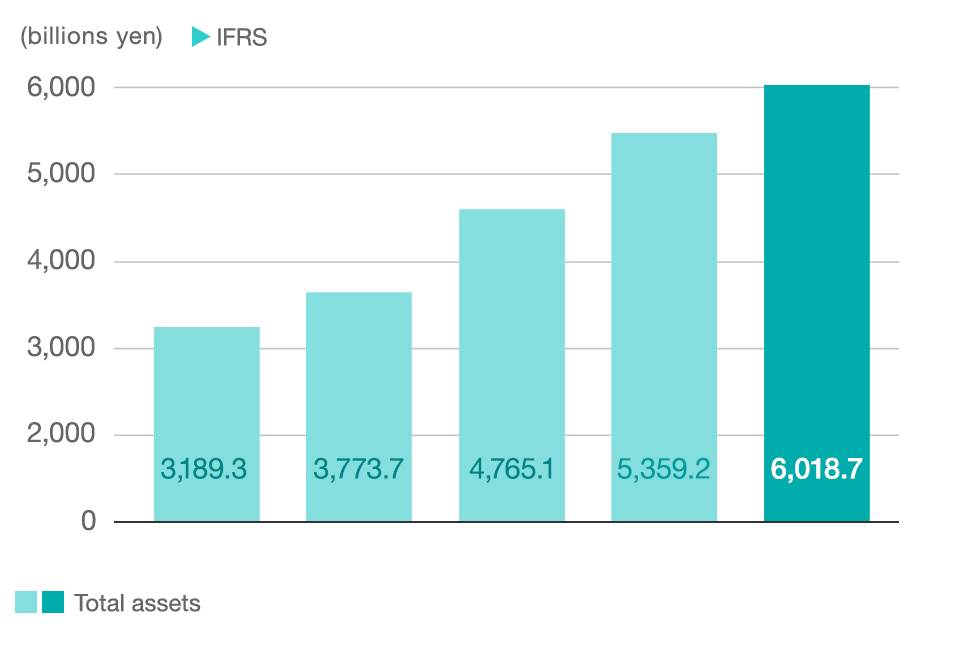
- 2021.12
- 2022.12
- 2023.12
- 2024.12
- 2025.12
-
Equity attributable to owners of the parent and Ratio of equity attributable to owners of the parent to total assets
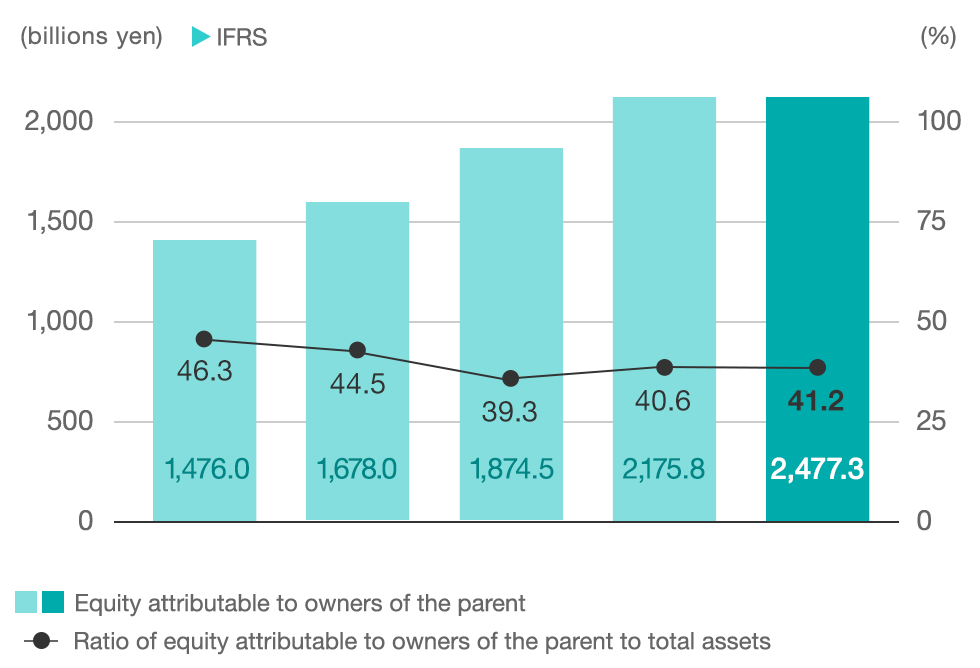
- 2021.12
- 2022.12
- 2023.12
- 2024.12
- 2025.12
-
ROA*1/ROE*2
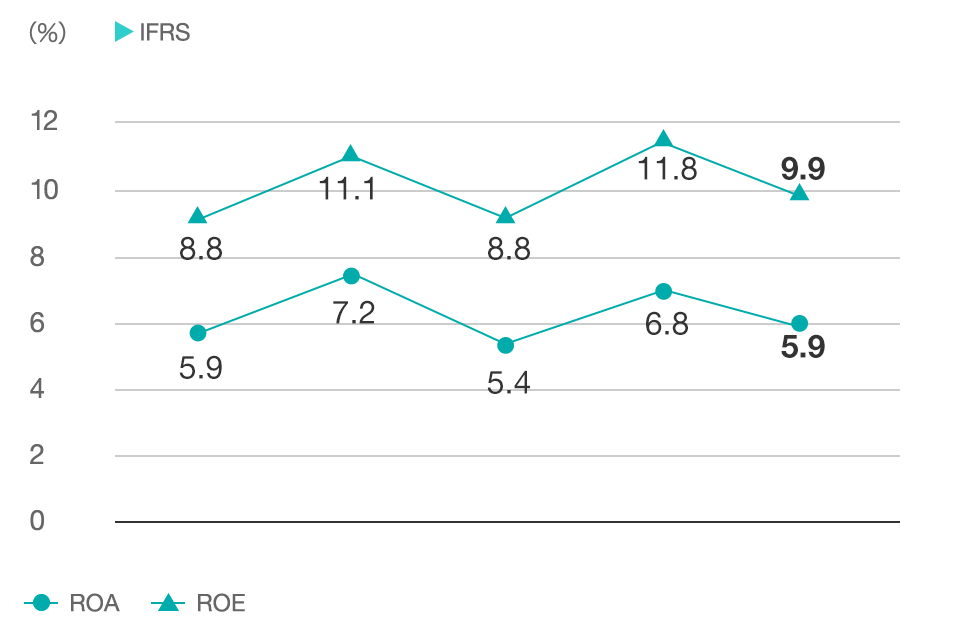
- 2021.12
- 2022.12
- 2023.12
- 2024.12
- 2025.12
- *1ROA = Profit before income taxes ÷ Total assets (average of beginning and end of fiscal year)
- *2ROE = Profit attributable to owners of the parent ÷ Equity attributable to owners of the parent (average of beginning and end of fiscal year)
Per Share Data (Yen)
| Fiscal year ended | IFRS | ||||
|---|---|---|---|---|---|
| Dec. 2021 | Dec. 2022 | Dec. 2023 | Dec. 2024 | Dec. 2025 | |
| Earnings per share(EPS) | 144.80 | 131.06 | 201.74 | 197.61 | 163.44 |
| Book-value per share(BPS) | 1,398.47 | 1,576.30 | 1,851.75 | 2,155.29 | 2,306.80 |
| Annual Cash Dividend | 42 | 44 | 48 | 50 | 50 |
| IFRS | |||||
|---|---|---|---|---|---|
| Dec. 2021 | Dec. 2022 | Dec. 2023 | Dec. 2024 | Dec. 2025 | |
| Earnings per share(EPS) | |||||
| 144.80 | 131.06 | 201.74 | 197.61 | 163.44 | |
| Book-value per share(BPS) | |||||
| 1,398.47 | 1,576.30 | 1,851.75 | 2,155.29 | 2,306.80 | |
| Annual Cash Dividend | |||||
| 42 | 44 | 48 | 50 | 50 | |
-
Earnings per share(EPS)
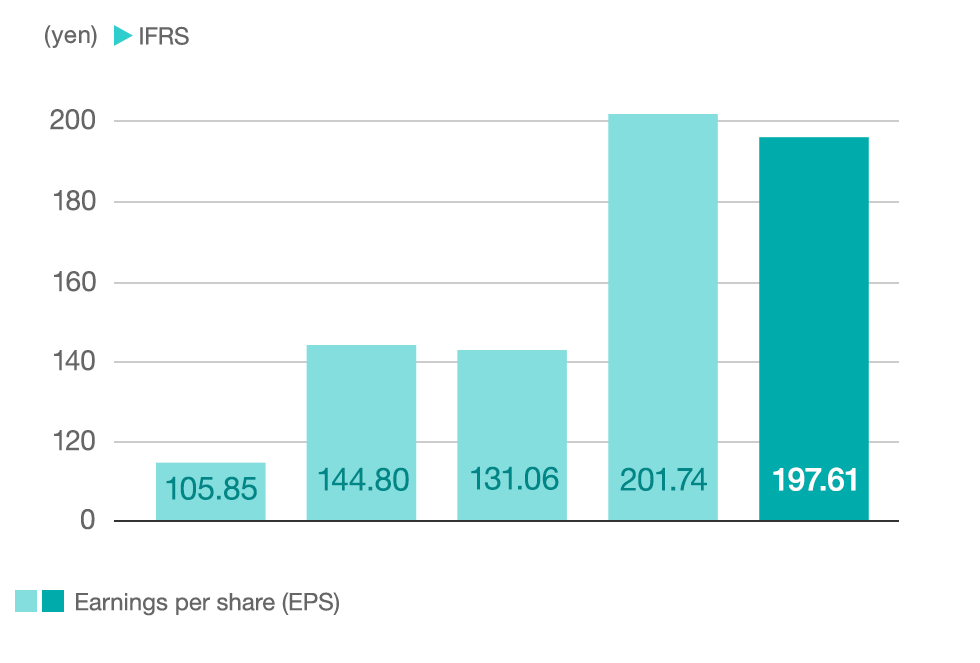
- 2021.12
- 2022.12
- 2023.12
- 2024.12
- 2025.12
-
Book-value per share(BPS)
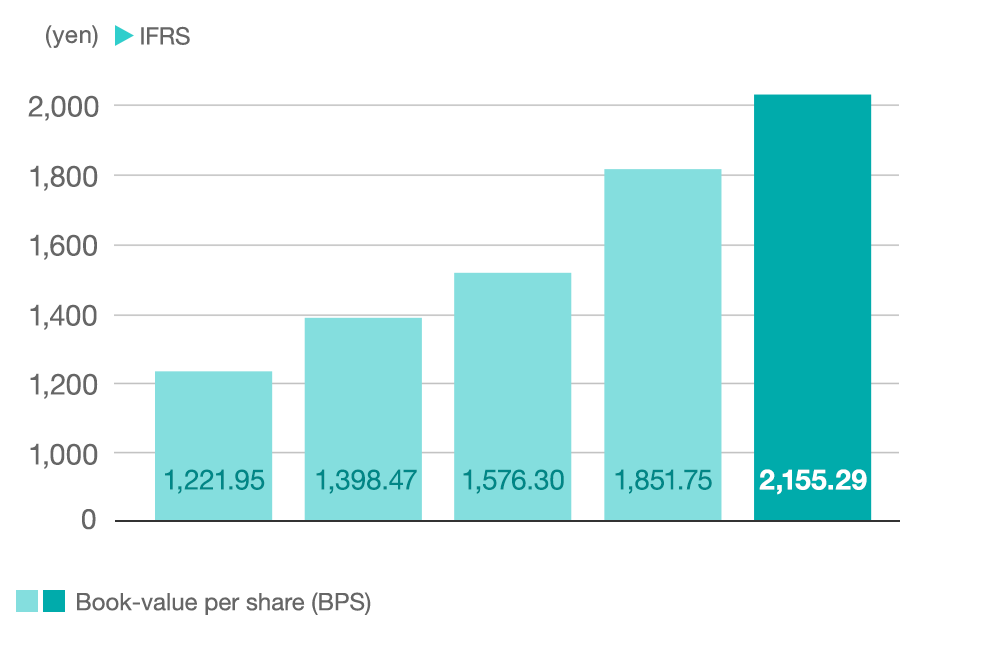
- 2021.12
- 2022.12
- 2023.12
- 2024.12
- 2025.12
-
Annual Cash Dividend Per Share and Shareholder Return Ratio
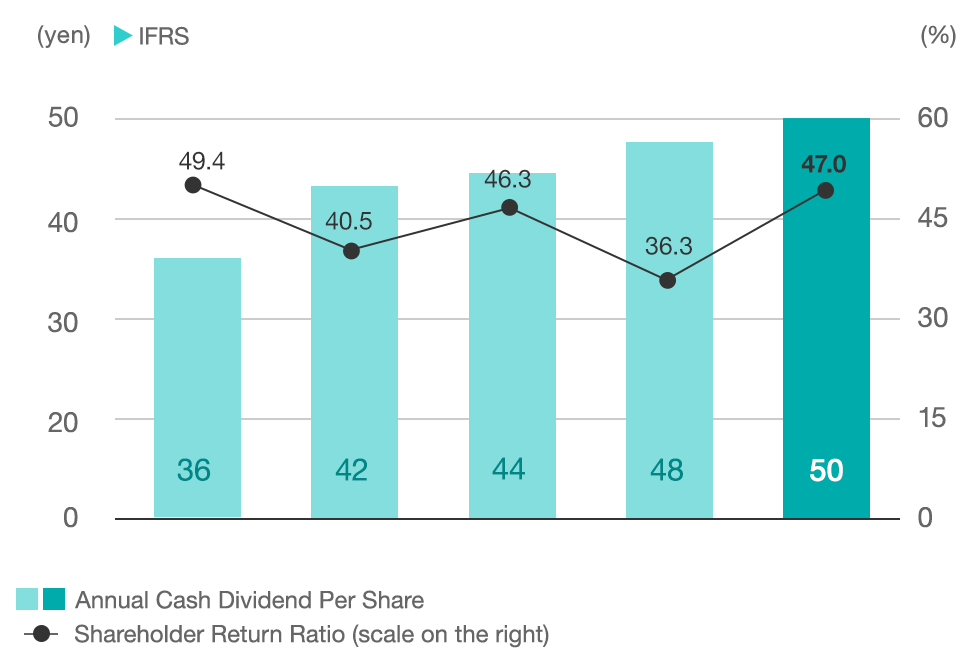
- 2021.12
- 2022.12
- 2023.12
- 2024.12
- 2025.12
Cash Flow
-
Net cash provided by operating activities and Free cash flow*3
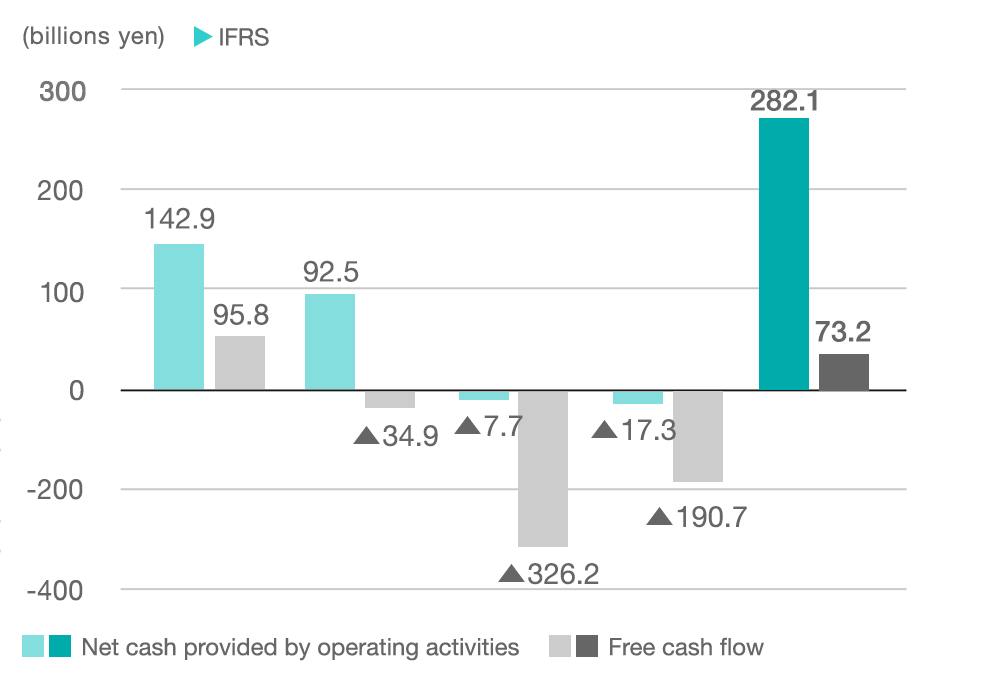
- 2021.12
- 2022.12
- 2023.12
- 2024.12
- 2025.12
- *3Free cash flow = Net cash provided by operating activities – Net cash used in investing activities
Capital Expenditures and R&D
-
Capital expenditures
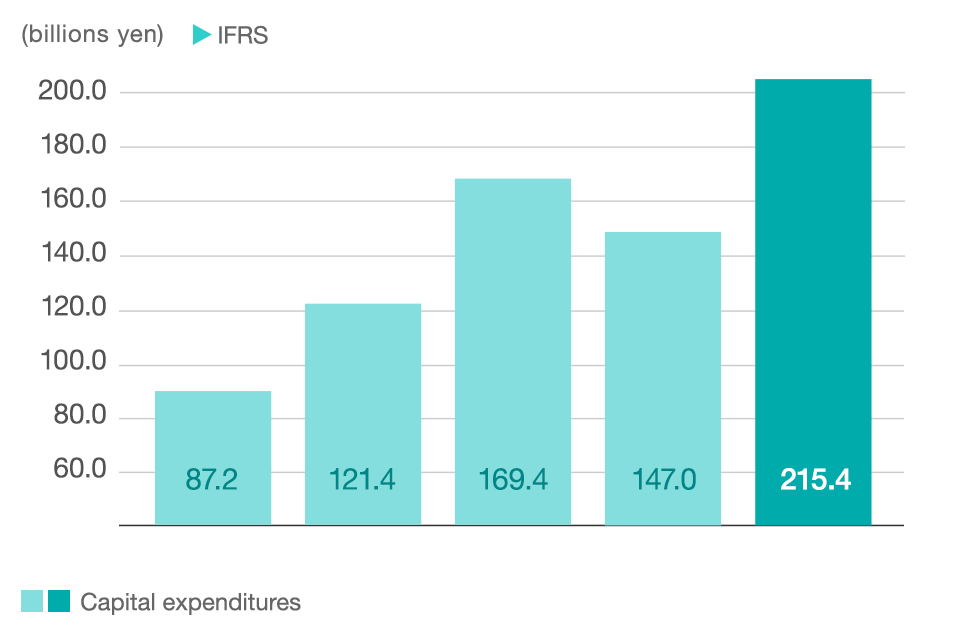
- 2021.12
- 2022.12
- 2023.12
- 2024.12
- 2025.12
-
R&D expenses
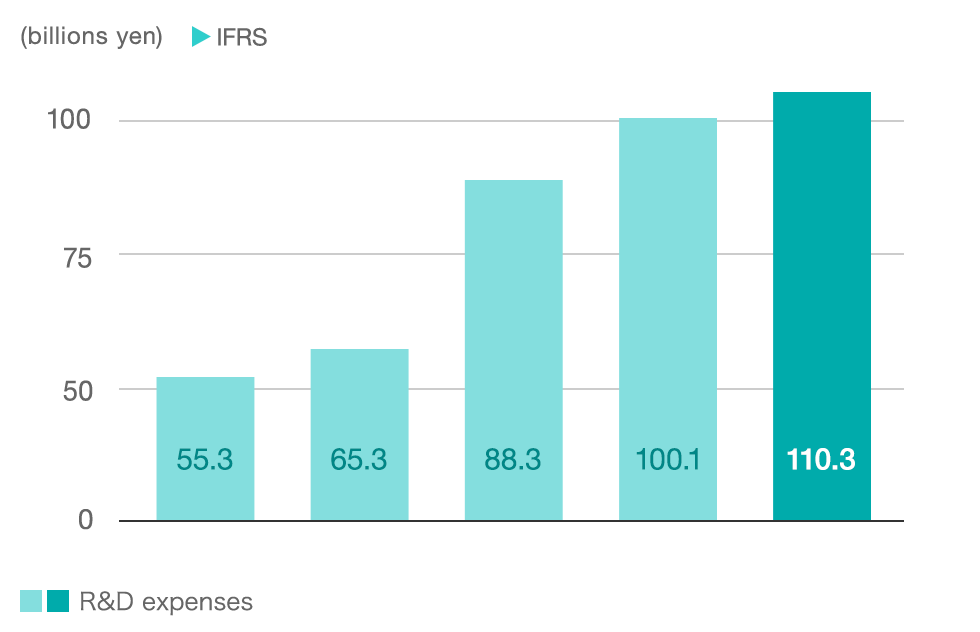
- 2021.12
- 2022.12
- 2023.12
- 2024.12
- 2025.12